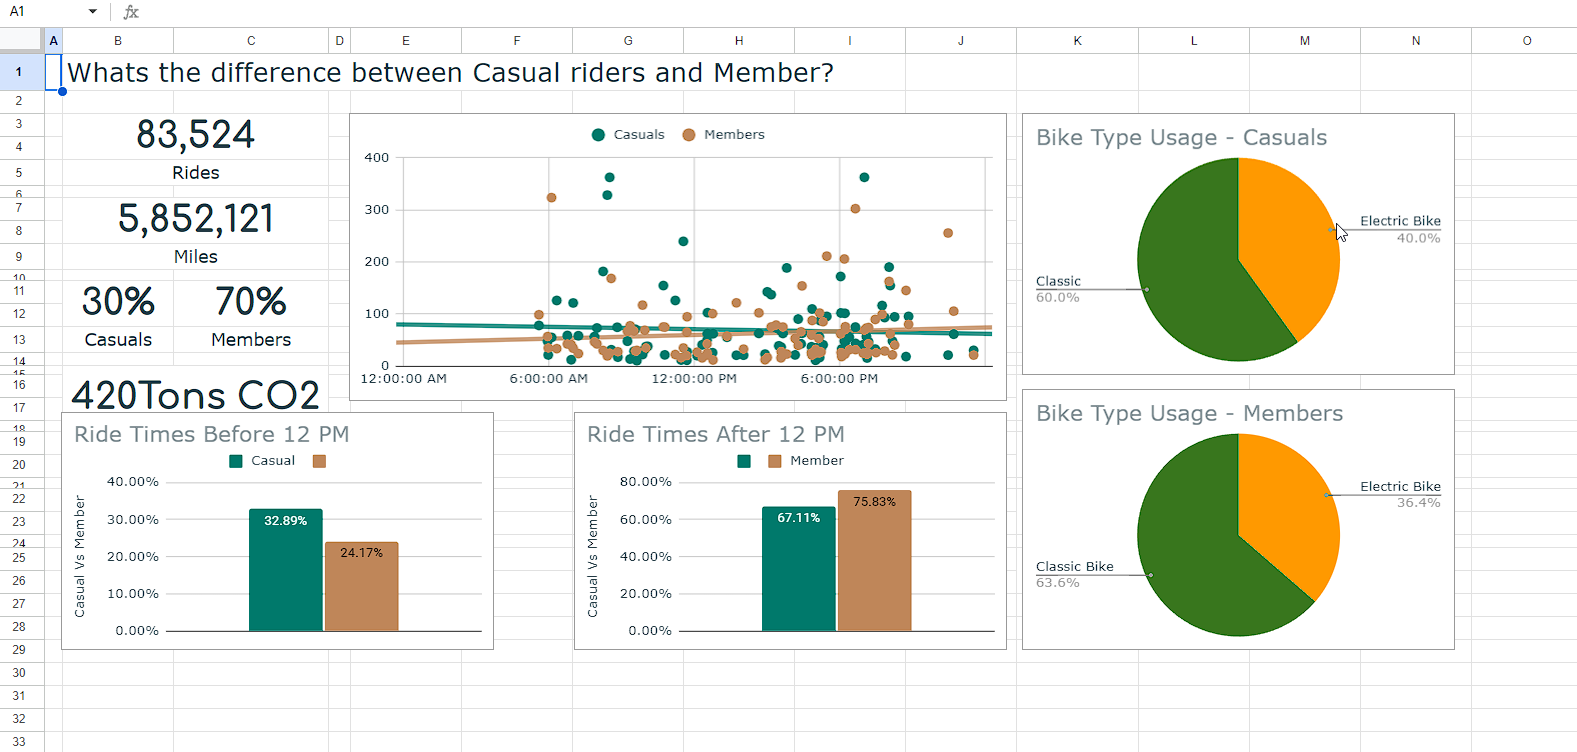
Dashboard Comparing Users of a service
used public data from a company and cleaned it. after cleaning data split into 2 variants to compare single use and reapeated use customers. Dashboard was created to represent the differences
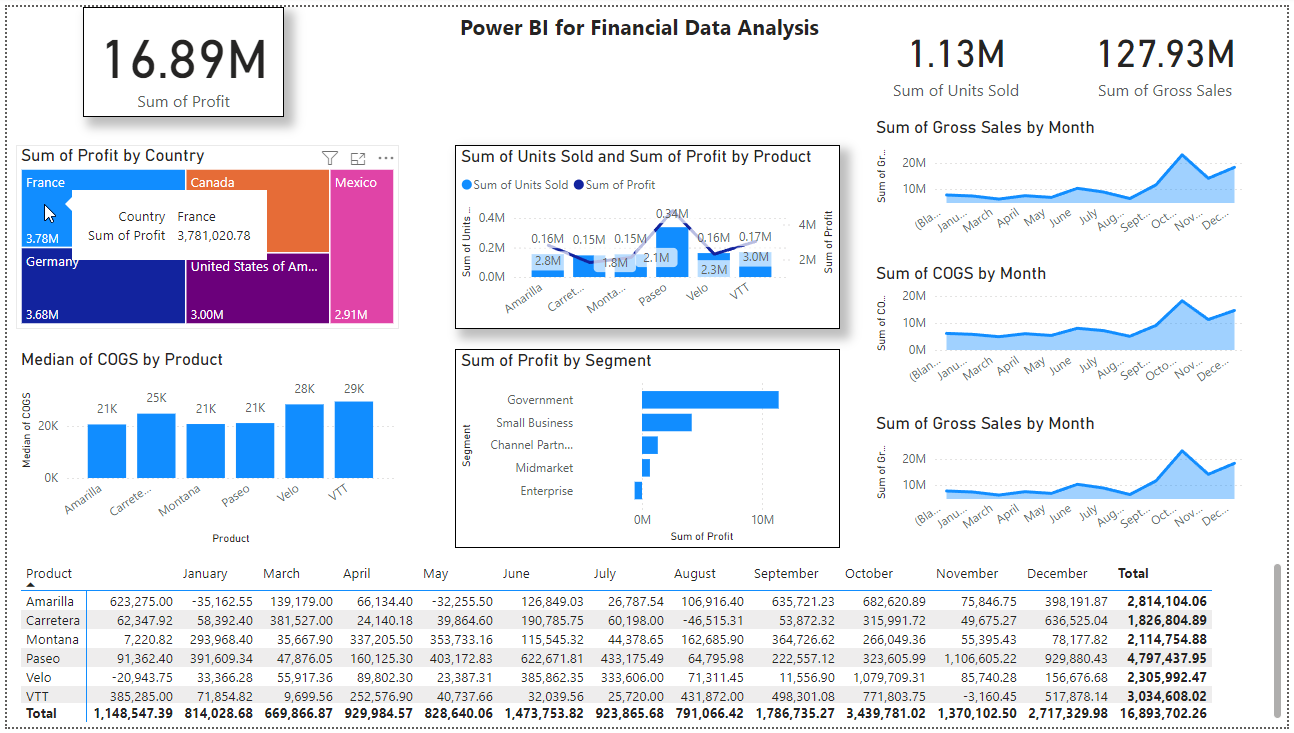
Dashboard showing COGS revenue
Power BI guided Capstone "file"
- Dashboard with dynamic Features.
- Used Power Query to clean data before constructing visuals.
- Determine relationships between data and use reference tables in Power Bi.
certificate
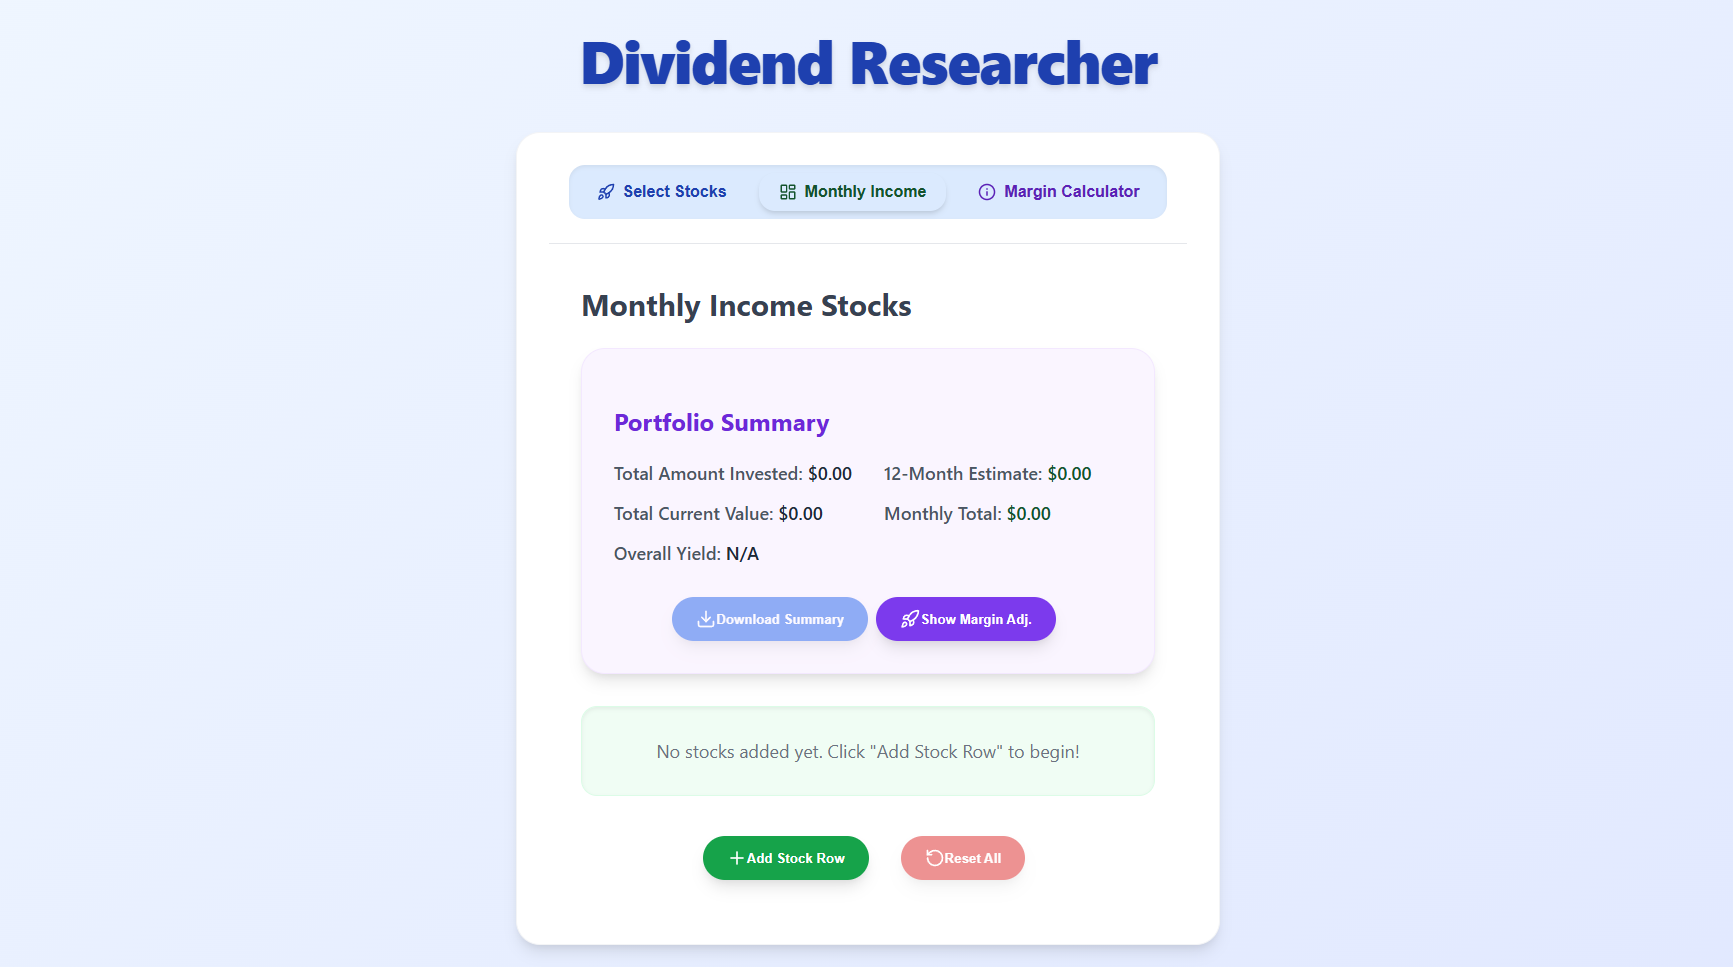
Dividends Researcher
- Web APP
- Track stocks and dividend income.
- Calculate potential margin interest costs (Robinhood).
- Visualize historical stock data with charts.
- Get AI summaries for companies and TSR.
- Monitor and log API usage.
- Saves all user data locally.
- Gemini used in building the app.